Escalating unemployment is one of the top news stories right now amid the coronavirus shutdown. Many industries are completely shuttered, others are operating but dramatically scaled back, and this has resulted in a vast number of people becoming unemployed.
I was curious to know, at what point will the United States hit levels higher than those we’ve ever seen in recent history?
Well, based on the numbers, that figure is about 10%, or 33 million based on the current U.S. population. But that doesn’t quite tell the whole story.
To get that number, we have to look back pretty far in history. The Balance has an interesting breakdown of unemployment statistics drawn from the U.S. Bureau of Labor Statistics and annotated with the events of influence happening at the time, from changes in minimum wage to tax cuts to wars. Data from 1929 to 1947 is actually just an estimation performed by the BLS, since formal statistics were not available prior to that. (Original Technical Note here.) I created a chart of the data since it’s easier to visualize, let’s take a look.
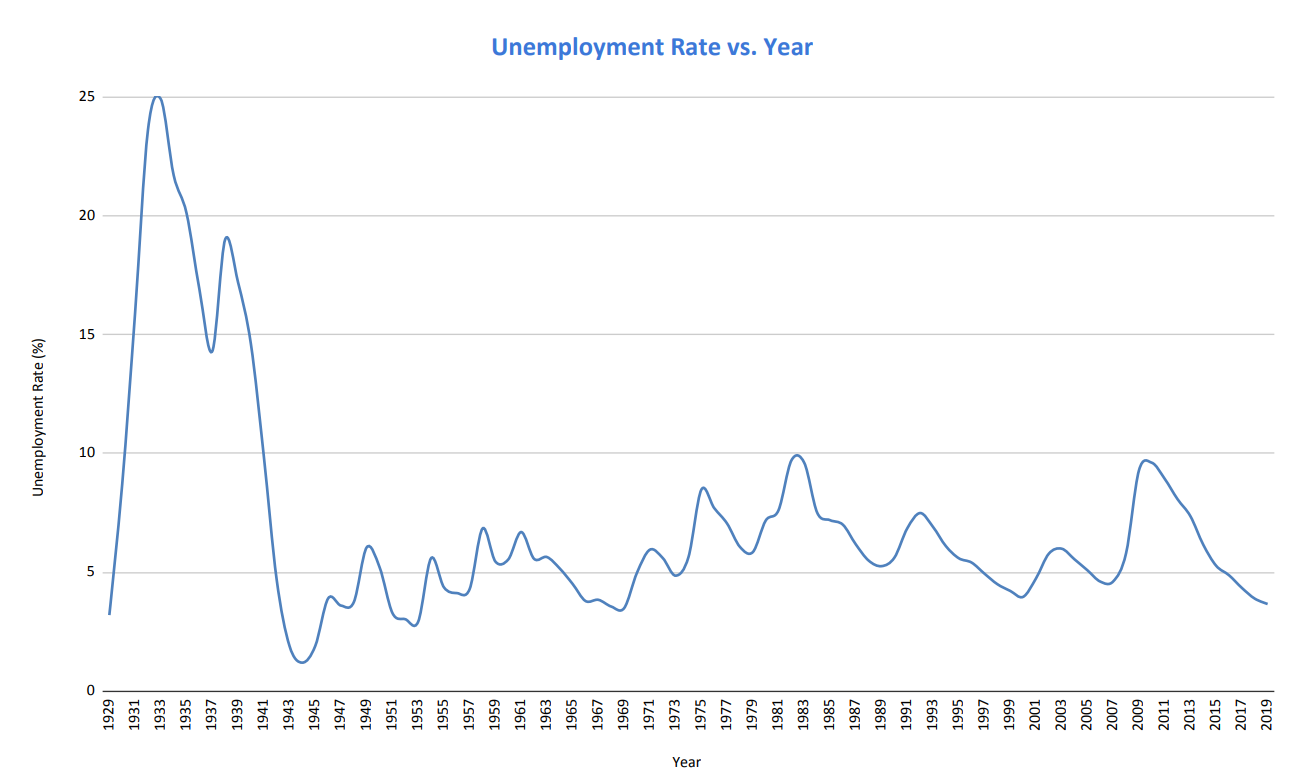
As you can see, U.S. unemployment has been below 10% for a long, long time. It crested up close to that in 2009/2010 after the mortgage crash/ financial crisis, and in 1982/1983 after the high inflation of the late 1970s. However, you have to go all the way back to 1940 before you find a higher number, at 14.6%.
One thing to bear in mind, however, is that the rates in the charts above are averaged annual rates for the entire year. When you look at monthly rates, the U.S. did actually exceed 10% at the end of 1982 and first half of 1983.
So for 2020 to average above 10%, the numbers shift a bit. Looking at 2020 year to date, unemployment in January was 3.6%, 3.5% in February, and 4.4% in March. 30 million filed for unemployment benefits last week, which is always below the actual number of unemployed, so it’s fair to expect that April will be near that 10% number.
To average above a 10% rate for 2020, therefore, unemployment would have to hit about 12.5% for the rest of this year, over 41 million Americans. If it does, we’ll be at a higher rate than we have been in the last 80 years, since before the U.S. entered World War II. Looking at the monthly data back to 1948, it’s also clear 2020 will hold the record for the biggest month-to-month unemployment change in history – by a lot.
So much of what’s happening is unprecedented, but it’s helpful to look back at historical trends, both to get a sense of what might be coming and to manage fear. It’s also clear that the rate at which the economy can bounce back this fall and winter, which nobody can predict right now, is going to have an enormous overall impact.